The Mux Data Blog
Insights and updates about Mux Data, real-time video analytics, and QoE monitoring. Learn how to build better video experiences with data.
Published on March 27, 2025 (over 1 year ago)
13 months of video insights: Long-term metrics is now GA
Mux Data long-term metrics is now GA, providing 13 months of data retention perfect for analyzing video performance and trends over time.

Published on March 11, 2025 (over 1 year ago)
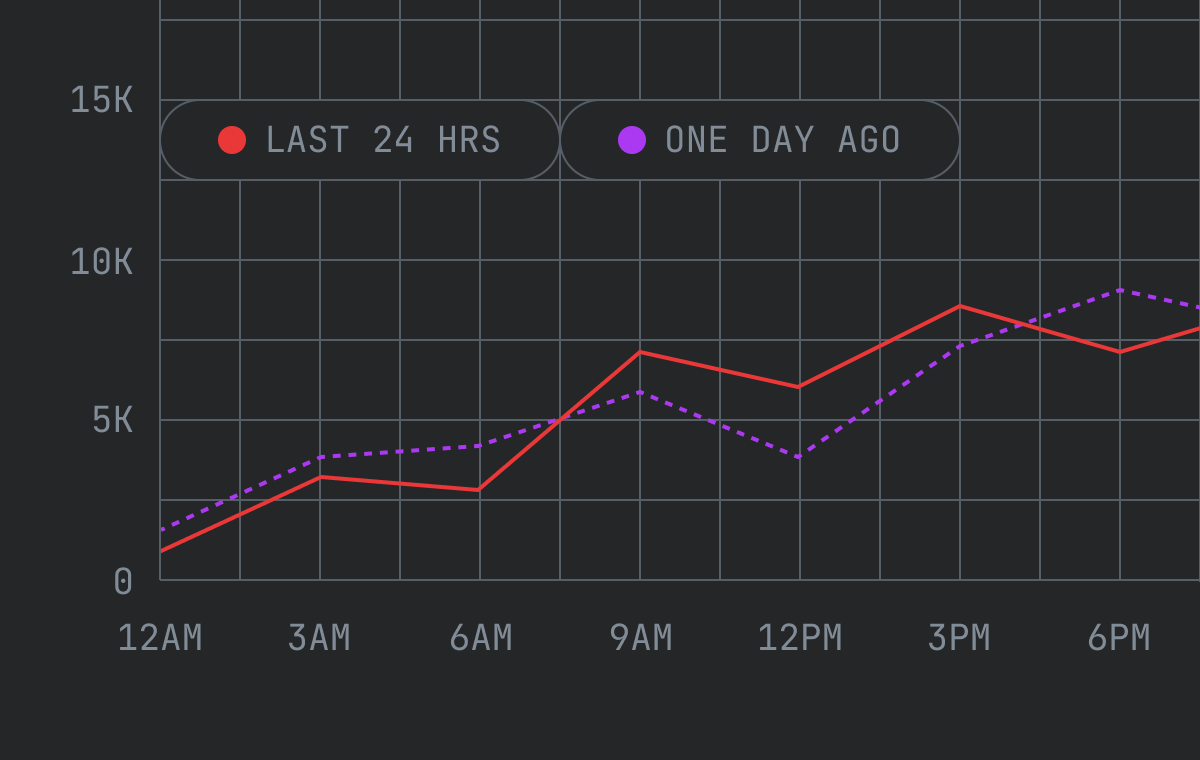
New data dimensions: More ways to analyze your video QoE
Introducing 16 new standard dimensions for QoE in Mux Data, helping you connect the dots between your technology stack and viewer experience
Published on December 12, 2024 (over 1 year ago)
Understand your video trends: Introducing Mux Engagement
Introducing Mux Engagement - a new way to understand your video trends and top-performing content. Get insights into viewer engagement, retention, and more.
Published on October 28, 2024 (over 1 year ago)
The case of the dropped views: New data metric for the QoE sleuth
Introducing View Dropped Percentage — a new Mux Data metric to help you identify trends in unexplained dropped views.
Published on September 9, 2024 (almost 2 years ago)
Mux Data now with long-ER term metrics
Introducing long-term storage for Mux Data, giving customers more flexibility to analyze video performance over time. Now in private beta.
Published on April 11, 2024 (over 2 years ago)
Off with our head: How we're making Mux Data play nice with everything
For data products to be fully utilized across an organization, they need to be interoperable and standards-based. Learn how we make this possible with Mux Data.

Published on April 9, 2024 (over 2 years ago)
Discover the latest Mux Data metrics and features
The Mux Data team has been hard at work building new metrics and next-level insights. Learn more about what they've been up to.
Published on February 23, 2024 (over 2 years ago)
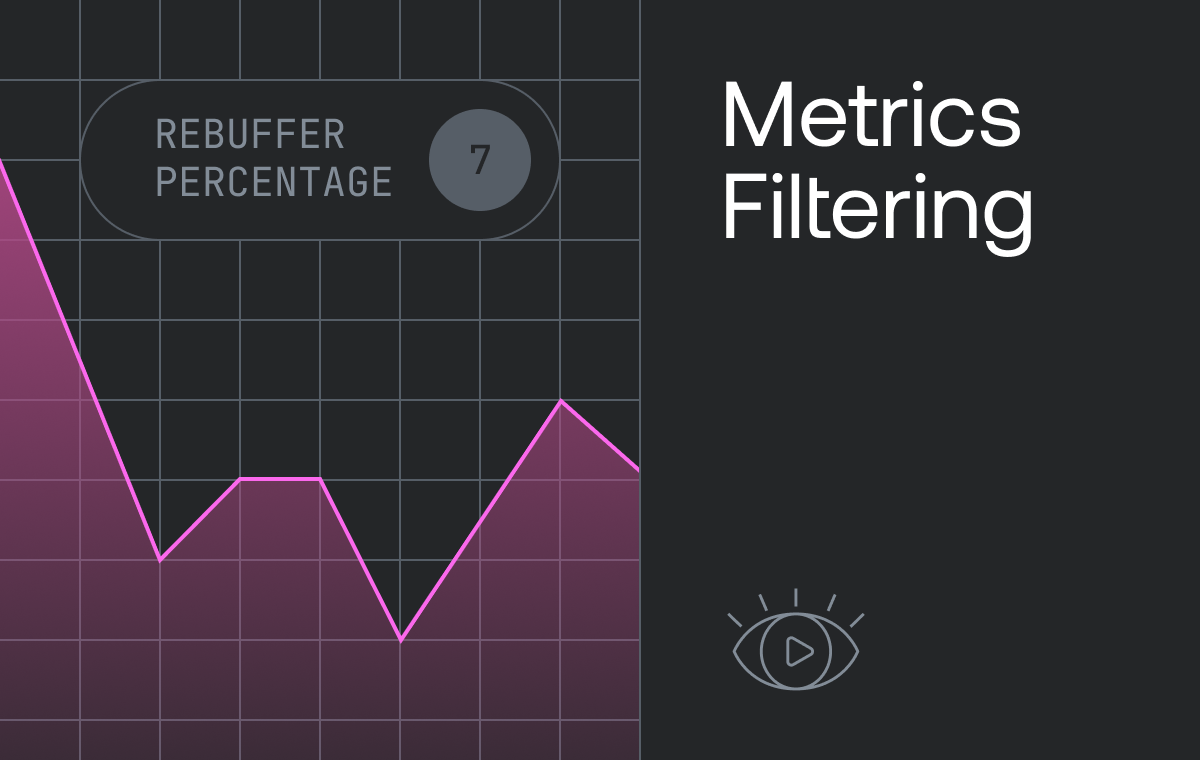
Introducing metrics filtering, the latest Mux Data feature
Filter out the noise and focus on the data that’s most important to you with new metrics filtering in Mux Data.
Published on December 11, 2023 (over 2 years ago)
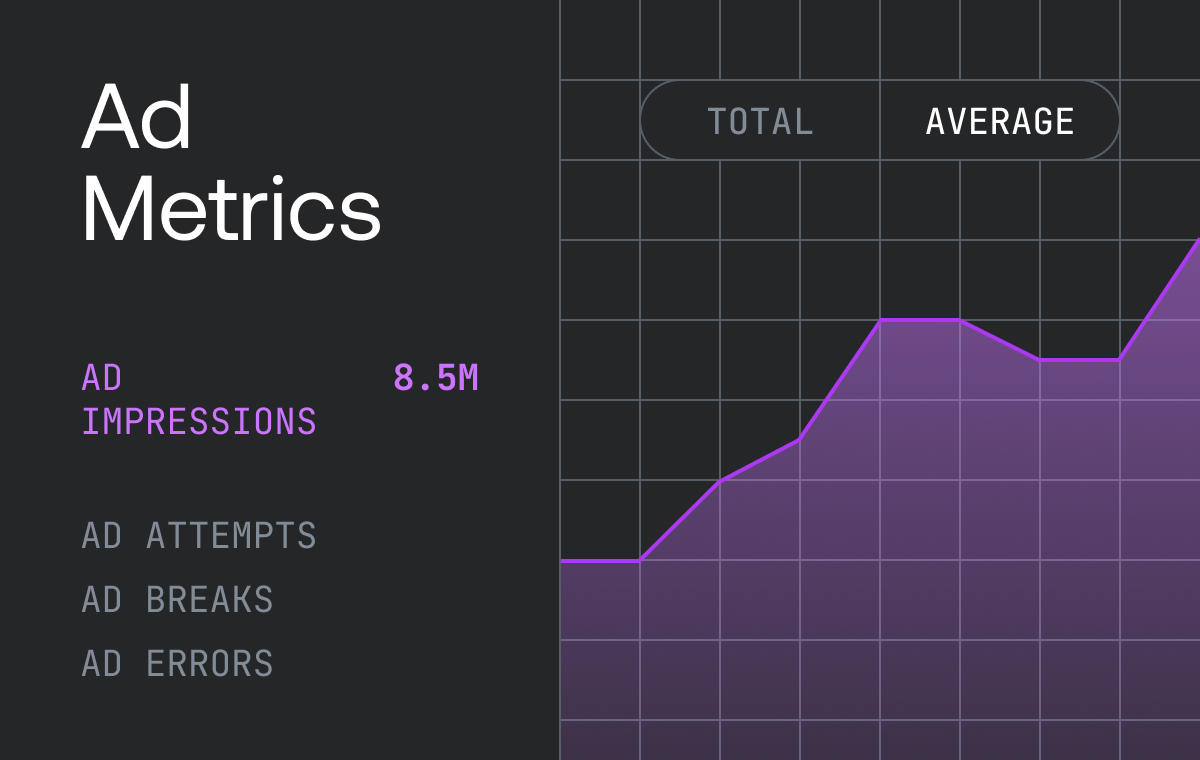
Beyond content: the crucial metrics for successful ad-supported streaming
New Ad Metrics are now in beta for Mux Data. Monitor ad performance and delivery and how they impact your viewers' QoE.
Published on April 4, 2023 (over 3 years ago)
Get more from your player analytics and Akamai CDN logs with CMCD
Using CMCD with Mux Data and Akamai, tie your viewer’s quality of experience analytics together with CDN performance logs to achieve end-to-end visibility.